Knowledge you can build upon
The I-Opt Map
Introduction
"...Leadership is the capacity to cause others to follow..."
"I Opt"® is a unique tool. It measures information flows. This means that "I Opt" qualities can be abstracted from the individual holding them. This contrasts with psychology where the variables are tied to a specific person by biology (e.g., "feelings" are by definition biological). This means that "I Opt" measurements can be applied to groups extending from small teams to entire firms.
This article describes how "I Opt" can be extended to the level of the firm. It shows how it can be used to assess entire organizations without losing the single individual in an abstraction. People remain visible and their influence on the whole can be seen. The way people are "wired" together is shown to set the range of behaviors the organization can, and will, exhibit. Qualities such as agility, responsiveness, learning, and values can be shown to arise as a result of this "wiring." The reach of the "I Opt" Map is deep.
Not only is the "I Opt" reach deep, but its grasp is strong. A solid theory provides "I Opt" with a frame capable of handling multiple social levels (Salton, 1996, 2000). The tool has been shown to work on individual, dyadic, and group levels. Use by tens of thousands of individuals, thousands of teams, and hundreds of firms on a worldwide basis testifies to its practical applicability. A complete validity study (Soltysik, 2000) has academically grounded the technology.
The first step in showing how "I Opt" applies to firms requires that we reformulate the concept of an organization. Starting from where we are now and proceeding step-by-step to where we must go is the purpose of the following sections.
Creating the "Map"
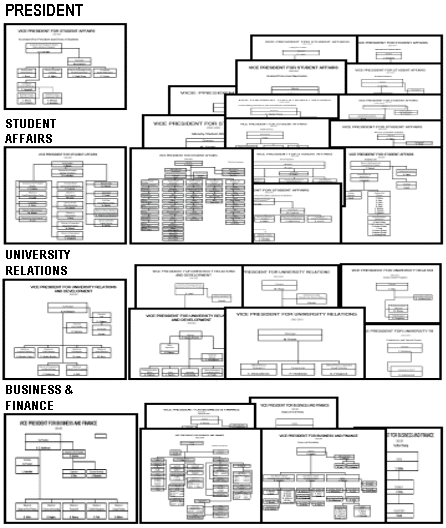
An organization chart is the traditional tool for "seeing" a firm. A partial example of a set of charts is shown in Graphic 1. These charts are useful Human Resource records, but they fail as a way of assessing a firm as a whole. The webs of relationships existing between any two points in an organization are lost in the detail. The chart only describes the chain of command. The nature of the interactions up and down that chain is ignored.
Graphic 1 - Partial University Organization Chart
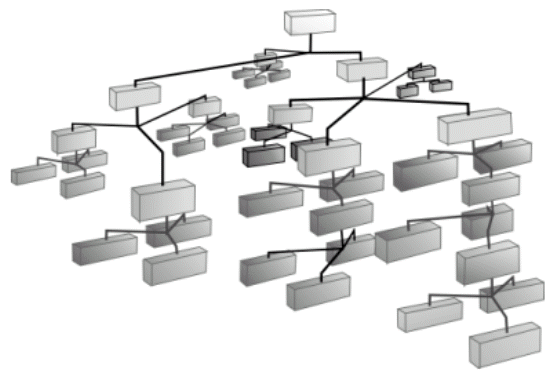
An option is to interlock organizational chart entries into a network, which is illustrated in Graphic 2. The two dimensional organizational chart has now evolved into a 3D graphic of some complexity. It can be an accurate representation and may even offer some metaphoric insights; however, it falls short as an analytical device useful in assessing an organization as an entity in and of itself.
Graphic 2 - Symbolic Organizational Representation
 \
\
An option available at this point is to apply a "coat" to the above 3D representation. This produces a solid object as shown in Graphic 3. The traditional organization chart has now evolved into a 3D pyramid. Again, it may be an accurate summarization but still of little value in engineering an organization.
Graphic 3 - Solid Organizational Representation

In order to render the solid representation into a useful form to organizational engineering, additional steps are needed. The first is to rotate the 3D pyramid so that we are looking down at its pinnacle. This is represented in Graphic 4.
Graphic 4 - Top View of Organizational Pyramid

Next, imagine that you place your hand on the top of the pyramid and depress it one level. This action is illustrated in Graphic 5.
Graphic 5 - Collapsing the Pyramid
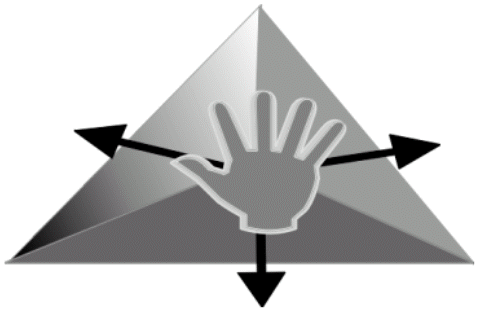
Continuing our symbolic analysis, we might expect the people who report to the CEO to "squirt" out as a result of the first compression. This is illustrated by Graphic 6. Effectively, we are reducing the 3D graphic back to a two dimensional picture.
Graphic 6 - Direct CEO Reports
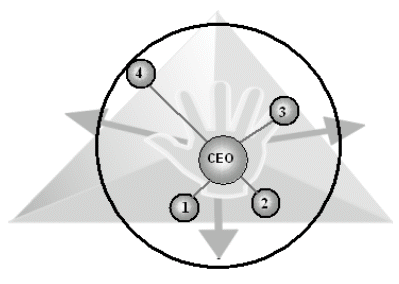
Not all of the CEO's direct reports "squirt" out the same distance. Some are close, some are far. The distance from the CEO is set by the frequency of interaction. The underlying idea is that a person cannot have an effect unless they have an opportunity to transmit their perspective. The more often they interact, the greater the opportunity.
The process continues. Imagine that you compress the pyramid again. Out "squirt" the people who report to the CEO's direct reports. The same principle applies. The less frequently they interact, the farther they are from the person to whom they report. This second level of compression is illustrated in Graphic 7.
Notice the arrow pointing to the "second level person" reporting to Executive #1 on Graphic 7. In terms of proximity, this second level person is equivalent to Executive #4 (see "information parity" brackets). This might be thought of as a capturing the common experience of a relatively junior executive having apparently inordinate influence on the affairs of a firm.
Graphic 7 - Second Level Reports
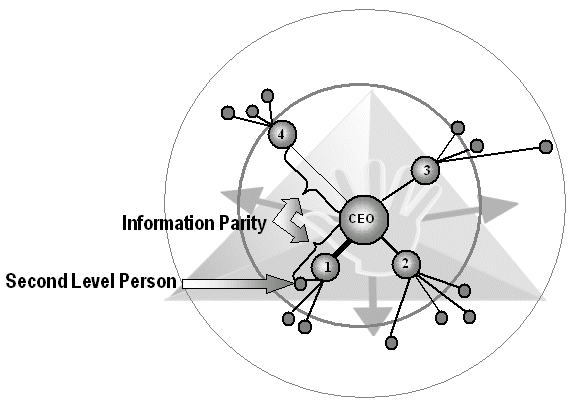
The process of compressing the 3D pyramid continues. With each compression, another level appears. The ultimate result of this process is shown in Graphic 8.
The "raw" version of Graphic 8 shows the initial result. The individuals are simply laid as they fall. The resultant pattern appears to take the form of tentacles. This is the natural consequence of the unitary chain of command characteristic of hierarchical organizations.
Graphic 8 also wraps the organization in a covering. Applying a coat to the organization serves to differentiate it from the environment within which it exists. This can be useful because information content is affected by location.
Graphic 8 - Completed Compression
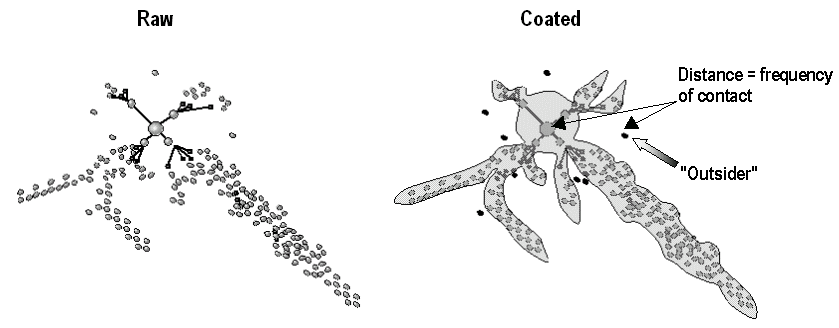
For example, the accounting staff lies toward the center of a tentacle. People in this function interact most often with other organizational insiders. The sales group, on the other hand, interacts with clients and has direct contact with the environment. Information flowing from people who lie on the edges (e.g., the sales group) are likely to contain raw data. It may be disjointe, but it is relatively without bias. People at the center of a tentacle (e.g., accountants) tend to use "second hand" data; however, because they are insulated from the turmoil of the environment, they can "digest" it into a focused and logical format. Recognizing the source and nature of this kind of difference can be important at both strategic and policy levels.
"...distance from the CEO is set by the frequency of interaction."
There are also "outsiders" represented in Graphic 8. Outsiders are vendors, consultants and others who have a semi-permanent relationship with the organization. These people can gather information from the environment (e.g., competitors, regulators, etc.) and furnish it to the firm. They are, in effect, external sensors. As Graphic 8 suggests, a firm can have many external sensors, each interacting with a different part of the firm and focusing on different subjects.
Even at this early point, the "I Opt" Map has been able to alert the engineer to exposures and opportunities. It has distinguished the firm from its environment. It has called attention to the value of external people. It has recognized differences in the information flows coming from the edges and the internal units of a firm. These are not new concepts but, providing a concise visualization is new.
How it Works
A this point we have a useful visualization of a firm in one "picture." We have translated a pyramid into something that looks more like an octopus or squid, and have located the individuals by their structural relation and the frequency of interaction. The visualization has been shown to offer insights for the design and application of initiatives. To take a deeper look into the functioning of the "thing" we have created is the next step.
Graphic 9 is a visual picture of one tentacle of the compressed pyramid. It shows people linked by formal relations. Tracing these paths reveal that there are redundant paths. In other words, information flows are not confined to a single channel. This means that is unlikely (but not impossible) for information to be blocked by a single person.
Graphic 9 - Tentacle Detail
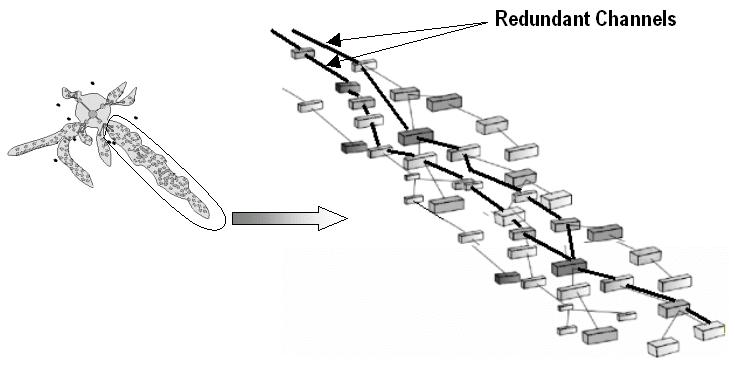
This is a useful insight. For example, a cultural action focused on "urgency" intended for product development may find its way into the safety department. What only involved cost considerations in one place could involve human life in another. A model or framework that calls attention to this potential is useful.
The more frequently people interact, the faster the information will move. This can be shown graphically by the length of the path connecting people or by its diameter; however, this is not the only factor influencing speed and character of transmission.
Graphic 10 shows each node in the chain occupied by a person with a specific "I Opt" strategic profile. Person A (a Reactive Stimulator) will tend to focus on the central aspects of a situation and is action-oriented ("doing" something about it). Person B is also comfortable with minimal operational detail, but they will tend to focus on the meaning of the information rather than acting upon it. This relationship will tend to slow information flows up the chain as meaning is assessed. In addition, the character of the flow is likely to change from action (Person A) to options (Person B). These results can be "read" directly from the "I Opt" Map.
Graphic 10 - Tentacle Detail with "I Opt" Profiles
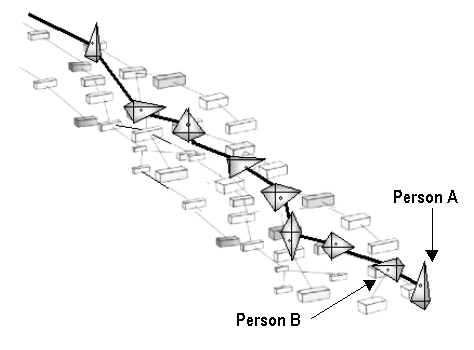
The frequency of interaction and the character of "I Opt" profiles produce stable and predictable effects that can be seen as an enduring pathway within a firm. The effects do not "come and go" or change capriciously. The network formed by this pathway seems to resemble the neurons and synapses in a nervous system. While this analogy has its limits, the systems are similar enough to suggest that organizations have a definable "nervous system." This is illustrated in Graphic 11.
Graphic 11 - Organizational Nervous System
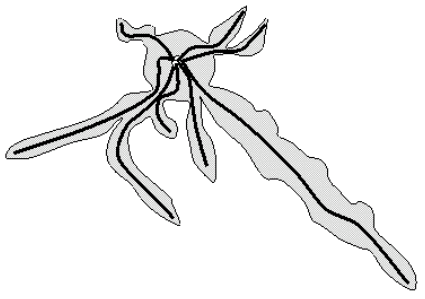
While still in the realm of a metaphor, this way of looking at the "I Opt" Map is useful. Referencing this mental image calls attention to the fact that every part of the firm is connected to every other part. Initiatives applied in one tentacle might well affect others.
For example, an initiative of "doing it right, the first time and every time" could improve product quality, but it could also result in delays that provide competitors an opening. An otherwise secure customer base might be threatened if the initiative is allowed to "leak" to the customer service units on the edges. The mental image of an entity with a nervous system calls attention to this kind of exposure.
"Movement"
Information flows have a purpose. They allow the firm to position itself to acquire input from the environment, or to more effectively "do its thing" (pursue the objectives for which it was formed). In other words, the information flows cause action.
Actions resulting from information flows can be seen as "moving" tentacles. Biologic organisms "move" in three-dimensional space. Organizational organisms "move" in other dimensions. These movements involve adjusting the firm's position relative to a factor or constituency on which the organization depends.
Although the concept of "movement" is an analogy, it is "real." The behavior of real people who make up the tentacle does change. The "inputs" available to the firm really do change. To some degree, the entire organization as an entity is affected. The concept of "movement" is an analogy, but one firmly founded on the concept of repositioning. This movement happens in an environment that the entity draws on for its sustenance. Both biological and organizational entities move. Only the dimensionality differs.
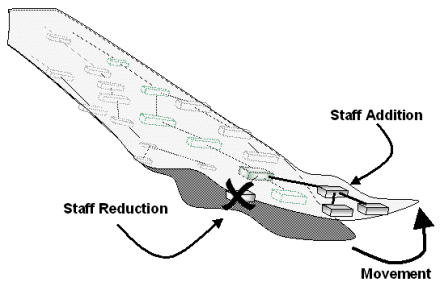
An example of a small shift in a tentacle is shown in Graphic 12. In this example, one function is substituted for another. This might be a firm dropping a Public Relations function and adding a Six-Sigma quality group. The tentacle shifts from a "customer" to a "product" dimension. There is no "visible" thing called a product dimension, but few firms would deny that it exists.
Graphic 12 - Small Tentacle "Movement"
Graphic 13 illustrates a large tentacle movement. This might be initiated by a policy shift. People might be asked to focus on a particular aspect of the environment. For example, a firm may decide to make "customer service" its highest value. If the initiative is successful, the firm's relationship with its customers will change. It has moved in its "customer" dimension.
Graphic 13 - Large Tentacle "Movement"
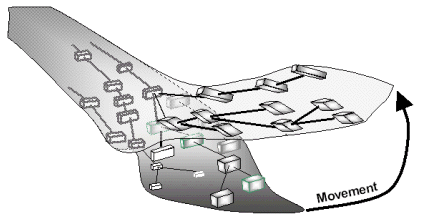
The two illustrations also show that the degree of movement is variable. In Graphic 12 the event was confined to the tip of the tentacle that limited the degree to which the firm as a whole needs to be involved. In Graphic 13, the event involved more of the tentacle and many components of the firm were impacted. This is rightfully considered a large movement.
Any movement of a tentacle requires energy in the form of effort and/or money. The greater the movement, the greater the expenditure. In addition, movement can affect relations with other dimensions. For example, a movement in "product space" can attract some customers and repel others. Moving in "customer space" can reposition a firm in "governmental space" (e.g., taxes or regulation). Even the three-dimensional space of the biological organism can be affected as a firm grows or shrinks in terms of its physical space needs.
The concept of movement is the least developed aspect of the "I Opt" Map. Some aspects of movement can be inferred. What is lacking is a metric describing the degree and direction of movement. In addition, a full inventory of the dimensions of movement is not available. Product and customer dimensions may be universal. Others may be unique to a particular firm (e.g., regulatory, legal, investor, creditor, etc.). At present, its value is metaphoric. It may serve to alert the engineer to an exposure or an opportunity. This value was deemed to be enough to warrant inclusion of a small "Movement" section in this paper.
A Mapping Application
Thus far we have relied on simplified illustrations to develop a new way of looking at an organization. This allows concepts to be clearly articulated. It also paints a vivid "picture" that is easily grasped and retained. To be useful however, the tool must be applied to actual institutions.
Graphic 14 applies the "I Opt" Map to a functioning institution. It "maps" the 469 person professional staff at a southern university with a population of about 8,000 students. The small format of the Journal of Organizational Engineering obscures some of the relationships. It also prevents showing the profiles of the people occupying each node in the system. These limits are those of this journal, not of the concepts or structure of the "I Opt" Map.
Even from this high level perspective, useful information can be gleaned. First, the entire university organization can be seen at a glance. The relative size of the Equal Opportunity, Title III, and Internal Audit functions is instantly put into the larger context. The relatively "skinny" tentacle of the Athletics department tells the engineer that the "bench strength" within the various sports is probably not very deep.
The Finance group shows a short but "thick" tentacle structure. This complexity suggests bureaucratic processes. Well defined relationships are needed to coordinate highly subdivided functions. Even without speaking to anyone, the likely management practice is known.
This is a university. It is not surprising to "see" Academic Affairs as the longest and most elaborate of the tentacles. Its length and relative narrowness tells a story. It speaks of a broad span of control. A quick check of the numbers confirms this observation. The Dean of Academic Affairs has 24 direct reports. This fact suggests that the Dean's position serves a coordination rather than management function. Much information has been gained with a glance.
Graphic 14 - Mid-Sized Southern University Professional Staff of 469 Individuals
- 1 - President
- 2 - Academic Affairs
- 3 - Finance
- 4 - University Relations
- 5 - Student Affairs
- 6 - Technology and Admin. Services
- 7 - Internal Audit
- 8 - Equal Opportunity
- 9 - Title III
- 10 - Athletics
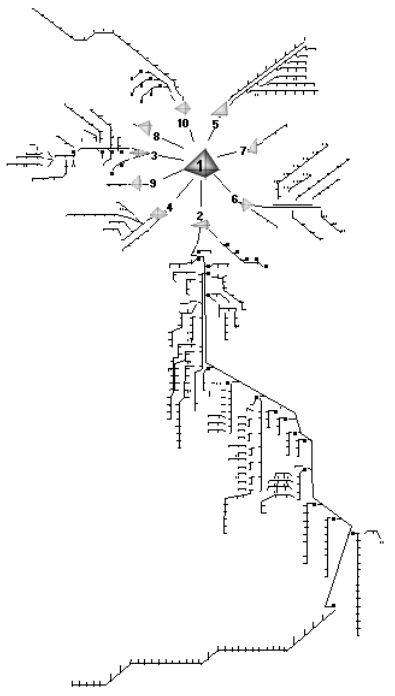
The "tip" of the Academic Affairs tentacle resembles the "skinny" Athletic Department. This section is the Agricultural Extension Field Offices that are located in various counties of the state. The need for "bench strength" in this applied area is probably not great. The structure also implies that the "reach" of this group is deep. Initiatives in this area will probably touch many people in different geographic areas. The "skinny" nature of the tip did not fill in these details, but it did alert the engineer to their likely existence.
These observations are enough to show that the "I Opt" Map is a practical tool even at the most macro of levels. Anyone reviewing it immediately gets a "picture" of the organizational unit. A bit of reflection allows some preliminary judgments to be made on the likely character of the organization subunits. These observations can be quickly confirmed by "drilling down" into the mapped structure.
This application of the concept of the "I Opt" Map shows the value of seeing an organization as a quasi-physical entity with a nervous system and a capacity for movement. The interconnected nature of the entity is easily visible. Global observations and preliminary judgments quickly surface. This level of analysis can be very useful to a CEO or to a governmental entity attempting to design the "rules of the game" for large entities.
However, the "I Opt" Map is much deeper than a simple global picture. It is founded on a causal ("what causes what") theory that applies to the mechanics happening inside the tentacles. The relationships between the individuals occupying each node can alert management to leadership issues, could be used to design more efficient and effective learning programs, and can even be applied to cultural initiatives. These, and many more qualities of an organization, are available by "digging in" to the "I Opt" Map.
A real application to leadership issues will help illustrate the usefulness of the "I Opt" Map at this deeper level. This is addressed in the next section.
A Leadership Application
A leader is a person others follow. Leadership is the capacity to cause others to follow in the leader's preferred direction. There are technical parts to leadership (e.g., planning, organization and control); however, a large portion of leadership ability has to do with the profiles of the people involved. For example, when a Reactive Stimulator (spontaneous action) says "fast" he/she may mean within 5 minutes. When a Hypothetical Analyzer hears "fast" it may mean the next few days. Both people are using the same language, but the meaning of the words differ. If you had known the profiles involved, you would have been able to predict the differences in meaning.
The effects of strategic profiles are not limited to the meaning of words. It affects assumptions, values, sources of satisfaction, risk behaviors and many other facets of life. The effect can be dramatic. Graphic 15 shows a segment of a telephone collection facility of a major finance company.
The facility in Graphic 15 had been working satisfactorily for a number of years, in spite of the fact that the Sr. VP and his direct reports had very different strategic profiles. The Sr. VP valued speed, favored a "let's give it a try" posture, and had a high tolerance for risk. The next two levels (VP and AVP) valued quality over speed, tried to avoid risk, and preferred traditional approaches that had a high certainty of outcome. In spite of this gulf, the facility worked as a business unit.
In the good years, the Sr. VP had used a "manage by walking around" (MBWA) practice. He would regularly talk to the Account Managers, providing advice, encouragement, and learning of issues on a first hand basis. He would take that knowledge back to his interactions with the VP and AVPs. He was well positioned to apply course corrections he felt were needed to compensate for their more cautious approach to business.
Changing conditions caused collection statistics to slip. Senior corporate executives began calling on a regular basis. The Sr. VP changed his practice and began staying in his office. The VPs and AVPs began to exercise their managerial preference in an unrestrained manner. Unfortunately, their subordinate Account Managers (as a whole) put a greater value on getting things done than doing them perfectly every time. Tensions began to rise. The Account Managers had lost their relief valve.
Graphic 15 - Partial Organizational Structure Telephone Based Collection Facility
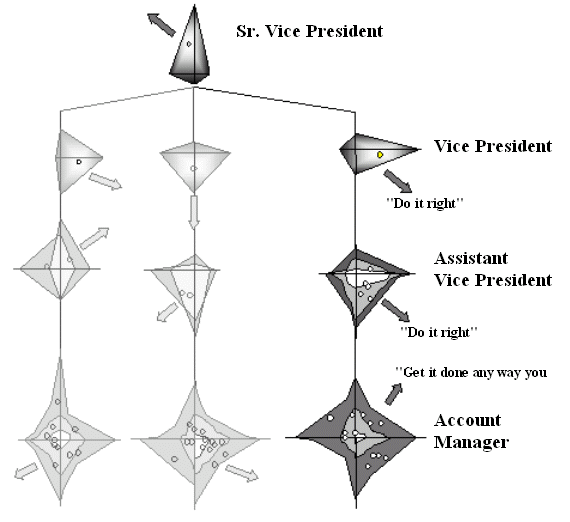
What had begun as an unhappy, but ordinary, business event evolved into organizational chaos. This further compounded the deterioration in collections. Squads of people from corporate began arriving on site to "help." In the end many people at all levels where no longer employed. The firm then had to suffer through a transition as their new employees found their "sea legs." The loss of a managerial practice (MBWA) had allowed the inherent vulnerabilities of structure to have free reign.
The "nervous system" graphic of the "I Opt" Map makes the exposure faced by the collection facility visible at a glance. The executives involved had developed a method of handling the issue, but it was "accidental." No one knew why things were working, they just were. Had the Map been available, the question of "why" might have arisen. If it had, the value of MBWA could have become visible, and it is possible that chaos could have been avoided. Without that knowledge, chance was the master of organizational fortunes.
Leadership issues can be seen in one-on-one relations. Graphic 16 shows the profile overlap of Shannon Nelson, Professional Communication's VP/COO and the author. The 15% overlap means that the two will differ on the "right" approach to about 85% of the issues they commonly confront. This is roughly the same condition that the Sr. VP and VPs faced in Graphic 15.
Graphic 16 - CEO vs. COO Strategic Profiles Professional Communications
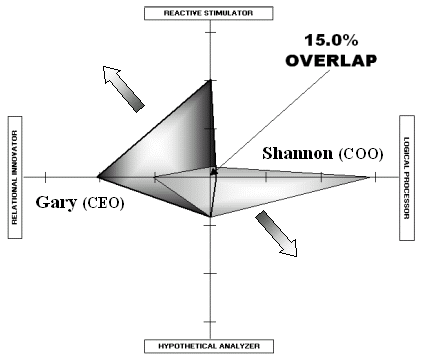
Both parties in Graphic 16 have intimate knowledge of "I Opt" technology and they fully understand the nature of their interactions. This removes the emotional edge from the differences that arise; however, both parties continue to believe that they have the "right" way. While both people know the kind of information the other needs, they sometimes have a hard time remembering to deploy that knowledge in the heat of intense discussions. Knowledge helps but it is not everything.
The general formula for a low overlap is to rely on division of labor, rather than synergy, as a managerial approach. This is the tool Shannon and the author use most frequently in resolving common issues. If the issue has high downside risk, utilizes known methods, and is not time sensitive, then Shannon's posture is favored. If the issue has low downside risk, involves unknown processes, and is time sensitive, then Gary's posture is favored. Both parties are aware of this protocol. It serves to make decisions more efficient and effective since each person focuses on what he/she does best.
The "I Opt" Map does not contain the overlaps shown in Graphic 16. Technically there is no reason that it could not be done; however, the importance of the overlap is situational. If Shannon and Gary were to meet only once per month, there would be little reason to invest in understanding or in the development of a protocol. The frequency (i.e., distance of the "squirt") would have automatically imposed a division of labor strategy. In addition, emotions would not likely be cumulative at that level of interaction. There is no sense in complicating the map unnecessarily.
The application of leadership issues to the map has shown only a small segment of a single "tentacle." It was a micro application. By using a complete "I Opt" Map, the leadership structure of an entire organization can be examined. Upward, as well as downward, relations can be assessed and examined in detail if warranted. The engineer can move leadership from a micro exercise to a policy-level, macro perspective.
A Learning Application
The main reason people learn is to improve the circumstances of their lives (Salton, 2005). People conduct their lives using their strategic profile as a guide. In other words, people want to learn in a way that will allow them to use the knowledge that they acquired. Strategic profiles describe how they want to go about acquiring and using this knowledge.
Graphic 17 - Training & Development Vs. Customer Services
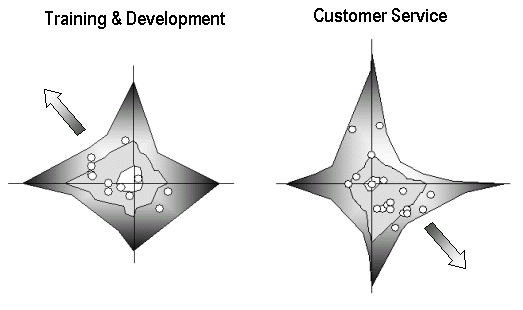
Each organizational tentacle is comprised of organizational units (e.g., departments, teams, work groups, etc.). Each of the units performs a different function and is likely to favor a strategic profile suitable to that activity. Graphic 17 contrasts the actual group profiles of two different functions existing within a larger firm.
The difference in approach is not surprising. Common sense is enough to suggest that people in Training and Development would favor a different approach than those in Customer Service. These two groups would be expected to prefer different levels of detail and are likely to be comfortable with different levels of certainty. They probably prefer to test knowledge differently (e.g., experimentation vs. analysis). If people want to learn the way they "do," teaching should be approached differently for these distinct groups.
There are methods of instruction that can be applied on a general basis. These tools try to find the common denominator of all information-processing approaches. Like any "one size fits all" tool, they work well enough to be acceptable, but they are suboptimal when applied to any specific case. In other words, for any given group there will usually be a better way to approach learning.
The "I Opt" Map provides a tool for assessing the parts of a firm affected by a learning initiative. Consolidating the profiles of the people in affected units will provide a measure of how well a particular approach is likely to work. This knowledge can then be applied to improve learning outcomes.
For example, the two groups in Graphic 17 favor different learning approaches. The Training and Development group will respond to instruction that focuses on options and alternatives which allow experimental application, and that is conveyed with strong emotional overtones. The Customer Service group will want more "how-to" instruction, will want to know the "why" of a particular direction, and will want it conveyed in a logical and deliberate manner. Applying the same approach to both groups is a recipe for mediocrity. Not every subject will warrant the kind of customization needed to optimize learning; however, the "I Opt" Map gives the engineer the option of excellence.
A Cultural Application
Culture is a word used to describe the shared beliefs, values, and behaviors of a group. Culture is important because it can be a substitute for management. Culture takes care of itself. Existing members guide new group members on acceptable behaviors. The group corrects deviants without the need for management attention. If aligned with the objectives of the firm, culture is an effective tool on both cost and operational levels.
There is also a flip side. Culture can frustrate managerial initiatives. A real situation illustrates this conflict. A major auto firm decided that innovation was the route back to a favorable market position. It launched an engineering initiative promoting ingenuity and inventiveness. The firm rewarded innovations, tracked inventive behavior, and systematically celebrated creativity as a cultural norm.
The firm's initiative worked, but not as expected. An executive heading one area noted that the firm now had a warehouse full of unique door hinges. Before the initiative, a single hinge had been used across multiple lines. Now the hinges had been optimized for each car line and model. There was an improvement in every case, but it was not the kind of progress the firm was looking for. A warehouse full of different hinges was not the objective.
The "I Opt" Map gives insight into likely cultural norms. This is because each of the "I Opt" strategic styles carries competency values (Salton, 2005). These values arise from the behavior generated by the strategic style preferences of the people in the group. This knowledge can help avoid misguided initiatives.
For example, a Logical Processor (LP) uses a structured input method. The LP will seek out information relevant to the issue at hand, and in doing so, will collect a lot of detail. They use logic to keep the high volume of particulars straight. A person regularly using an LP approach will undoubtedly come to "value" logic as a tool for navigating life.
The LP also favors action as an output mode. A willingness to take action means that the penalty for error is quickly felt. The net result of a detail rich, logically consistent, and action-oriented information-processing strategy is risk aversion—the LP "values" certainty of outcome.
The above description of value creation is incomplete, but it is enough to explain what happened in the auto manufacturer example. The mechanical engineers responding to the innovation initiative had a significant LP component. Graphic 18 shows an actual distribution of a typical group of engineers from the company in question.
Graphic 18 - Automotive Engineers, Three department sections, 33 people
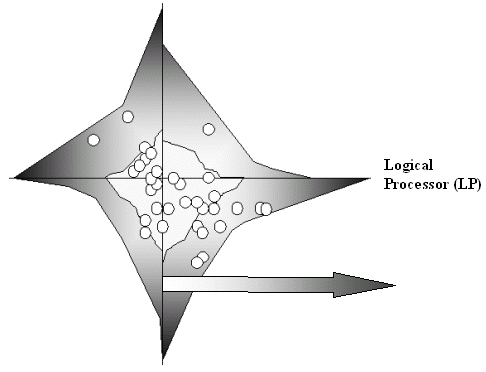
The group clearly favors the LP strategic style. In addition, the people tend to cluster. This means that group, as well as individual, processes will be at work. Any individual coming up with a "radical" idea is likely to be reminded of all of the ways the idea can fail, and the consequences of possible failure are likely to be made vivid. Effectively, the group will operate to bring the deviant in line with the cultural values of facts, logic, and certainty.
The result of an "innovation" initiative in a culture dominated by LPs is incremental improvement. The engineers acted in an intelligent and positive manner. They saw the "facts" involving the portion of the product line for which they were responsible. The strategy they used was both tested and effective. After all, the Japanese automakers gained command of a major share of the American market by making incremental improvements year after year.
The "I Opt" Map can be used to assess both culture itself and its likely affects. The profiles of the people occupying the nodes in an affected area can be consolidated as shown in Graphic 18. Clusters of people are easily seen. The likely direction of the cultural norms can be determined. Leadership "bottlenecks" and "amplifiers" are easily identified. This kind of knowledge can be used to formulate initiatives before they are launched. The knowledge can even be used to foster or frustrate the culture itself. The "I Opt" Map opens up many possibilities.
Summary
The forgoing application examples do not exhaust the potential for the "I Opt" Map. Change Management, Six-Sigma quality programs, and Succession Planning are only a few of the areas that might benefit from its use. The potential benefits are broad.
The theory underlying the "I Opt" Map is strong. The tentacled visualization of the firm is a natural outgrowth of the unitary chain of command of hierarchical organization. Strategic profiles that act as the "cells" in the nervous system are derived from the fully validated "I Opt" Survey. The processes used to consolidate people into groups have been tested in thousands of cases involving real firms, real groups, and real organizational issues. The "I Opt" Map is not a speculative adventure. It is a realistic option.
The "I Opt" Map is also a flexible tool. As much or as little of an organization can be mapped as is required. All that is necessary is for everyone in the area being assessed to spend five minutes completing the "I Opt" Survey. There is no need for interviews or interpretation. The fact that "I Opt" is 100% mechanized means that it is a practical option.
The combination of a strong theoretical base, the well-tested "I Opt" measurement tool, and the computer based assessment mean that the "I Opt" Map is a practical and useable tool. All that is needed to gather its benefits is 1) an issue, and 2) an organization.
Bibliography
- Kolb, D. (1985). Learning styles inventory. Boston: McBer & Company.
- Salton, Gary J. (2003) Organizational Engineering Seminar. Ann Arbor, MI.
- Salton, Gary J. (2004) Organizational Engineering Seminar. Ann Arbor, MI..
- Salton, Gary J. (2005) Organizational Engineering Seminar. Ann Arbor, MI.
- Soltysik, Robert (2000). Validation of Organizational Engineering
- Instrumentation and Methodology. Amherst, MA. HRD Press.
Author
Gary Salton is Chief: Research & Development and CEO of Professional Communications Inc., the firm that develops and deploys "I Opt" technology. Dr. Salton holds a MBA, an MA in Economics and a Ph.D. in Sociology.
In addition to scholarly interests, Dr. Salton has held managerial and senior executive posts in investment banking, real estate, and automotive industries. He has held positions as Sr. Vice President, Corporate Controller and Chief Planning Officer among others.
Dr. Salton founded Professional Communications Inc. in 1991 and has devoted much of his effort since then to creating, developing, and deploying technology that is intended to improve the human condition through the discovery of factors and processes involved in group behavior.
It is Dr. Salton's practice to make new discoveries first visible at the seminars he conducts in Ann Arbor, MI. They are documented in books, articles, and other publications as time becomes available.
Dr. Salton can be reached in his Ann Arbor, MI office at (734) 662-0250. ©2006, Organizational Engineering Institute. All rights reserved.
Organizational Engineering Institute
101 Nickels Arcade
Ann Arbor, MI 48104
Phone: 734-662-0250
Fax: 734-662-0838
E-Mail: OEInstitute@aol.com
ISSN: 1531-0566
For additional copies of this article please visit: www.oeinstitute.org
"I Opt"® and TeamAnalysis™ are trademarks of Professional Communications, Inc.
Printed in the United States of America